A Guide to Understanding and Preventing School Bullying

Bullying among 12- to 18-year-old students has declined over the past decade, but approximately 1 in 5 students still experience bullying on school property, the National Center for Education Statistics (NCES) reports (PDF, 4.6 MB). To create bully-free schools that allow students to focus on learning, administrators and teachers can better understand how bullying occurs. The USC Rossier School of Education, which offers the MAT online program, has put together the following guide to help schools navigate this pressing issue.
What Is Bullying?
The NCES says bullying is often characterized by three of the following elements:
INTENT TO HURT
The aggressor seeks to inflict physical, social and/or emotional harm.
REPETITION
The aggressor’s behavior is recurrent.
POWER IMBALANCE
The victim feels inferior to or less powerful than the aggressor.

Students were also asked whether bullying was related to specific characteristics. The most common characteristics bullying was related to included:
- Physical appearance
- Race
- Gender
- Disability
- Ethnicity
- Religion
- Sexual orientation
Bullying Statistics: How Prevalent Is the Problem in Schools?
Nearly 12% of public schools reported bullying at school at least once a week in 2017, according to NCES data. That percentage was highest for middle schools (21.8%), followed by high schools (14.7%) and primary schools (8.1%).
Stopbullying.gov identifies common bullying tactics students use, including:

Verbal bullying: teasing, making sexual comments, threatening.

Social bullying: isolating, embarassing, spreading rumors.

Physical bullying: aggressive gesturing, assaulting, destroying possessions.

Of students who reported bullying, more than 40% said they believed it would occur again.
Cyberbullying Statistics: How Prevalent Is the Problem Among Students?
With more students constantly connected to digital devices and social media, schools are having to address electronic bullying. According to NCES:
15%
of high school students reported being cyberbullied in 2017.
1 in 4
middle and high schools reported cyberbullying problems at least once a week.
15%
of middle and high schools said school environment was affected by cyberbullying.
How Does Bullying Affect Students?
According to a bullying prevention fact sheet from the Centers for Disease Control (PDF, 600 KB), bullying can have a number of negative outcomes. Students who are bullied may experience:
- Physical injury
- Social and emotional distress
- Increased risk of depression and anxiety
- Difficulties sleeping
- Lower academic achievement
- Increased likelihood to drop out of school
- Self-harm
- Death

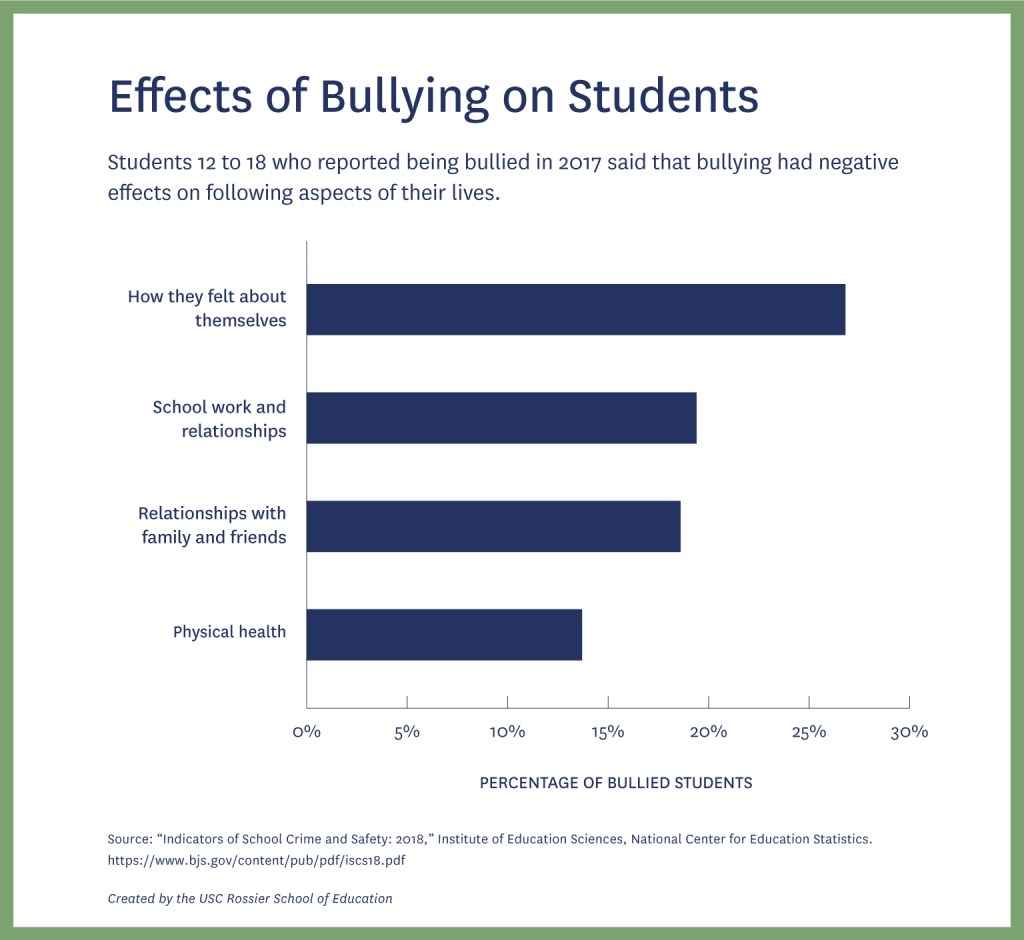
Go to the bottom of the page to review tabular data about the negative effects of bullying.
However, the harmful effects of bullying are not limited to those who experience it. Students who bully face increased risk of substance misuse, academic problems and violence later in life. Those who bully others and are bullied experience the most serious behavioral and mental health problems.
How Can Schools Address Bullying?
Creating a safe learning space for children requires buy-in from the top down. Bullying.gov highlights the unique role administrators play in preventing bullying (PDF, 173 KB), including:
- Providing bullying prevention training so staff are better equipped to intervene.
- Establishing and consistently enforcing policies against bullying.
- Talking with students about their concerns and helping them build social and emotional skills to help address the issue.
- Collecting data on bullying to understand how frequently and where it’s occurring on school grounds.

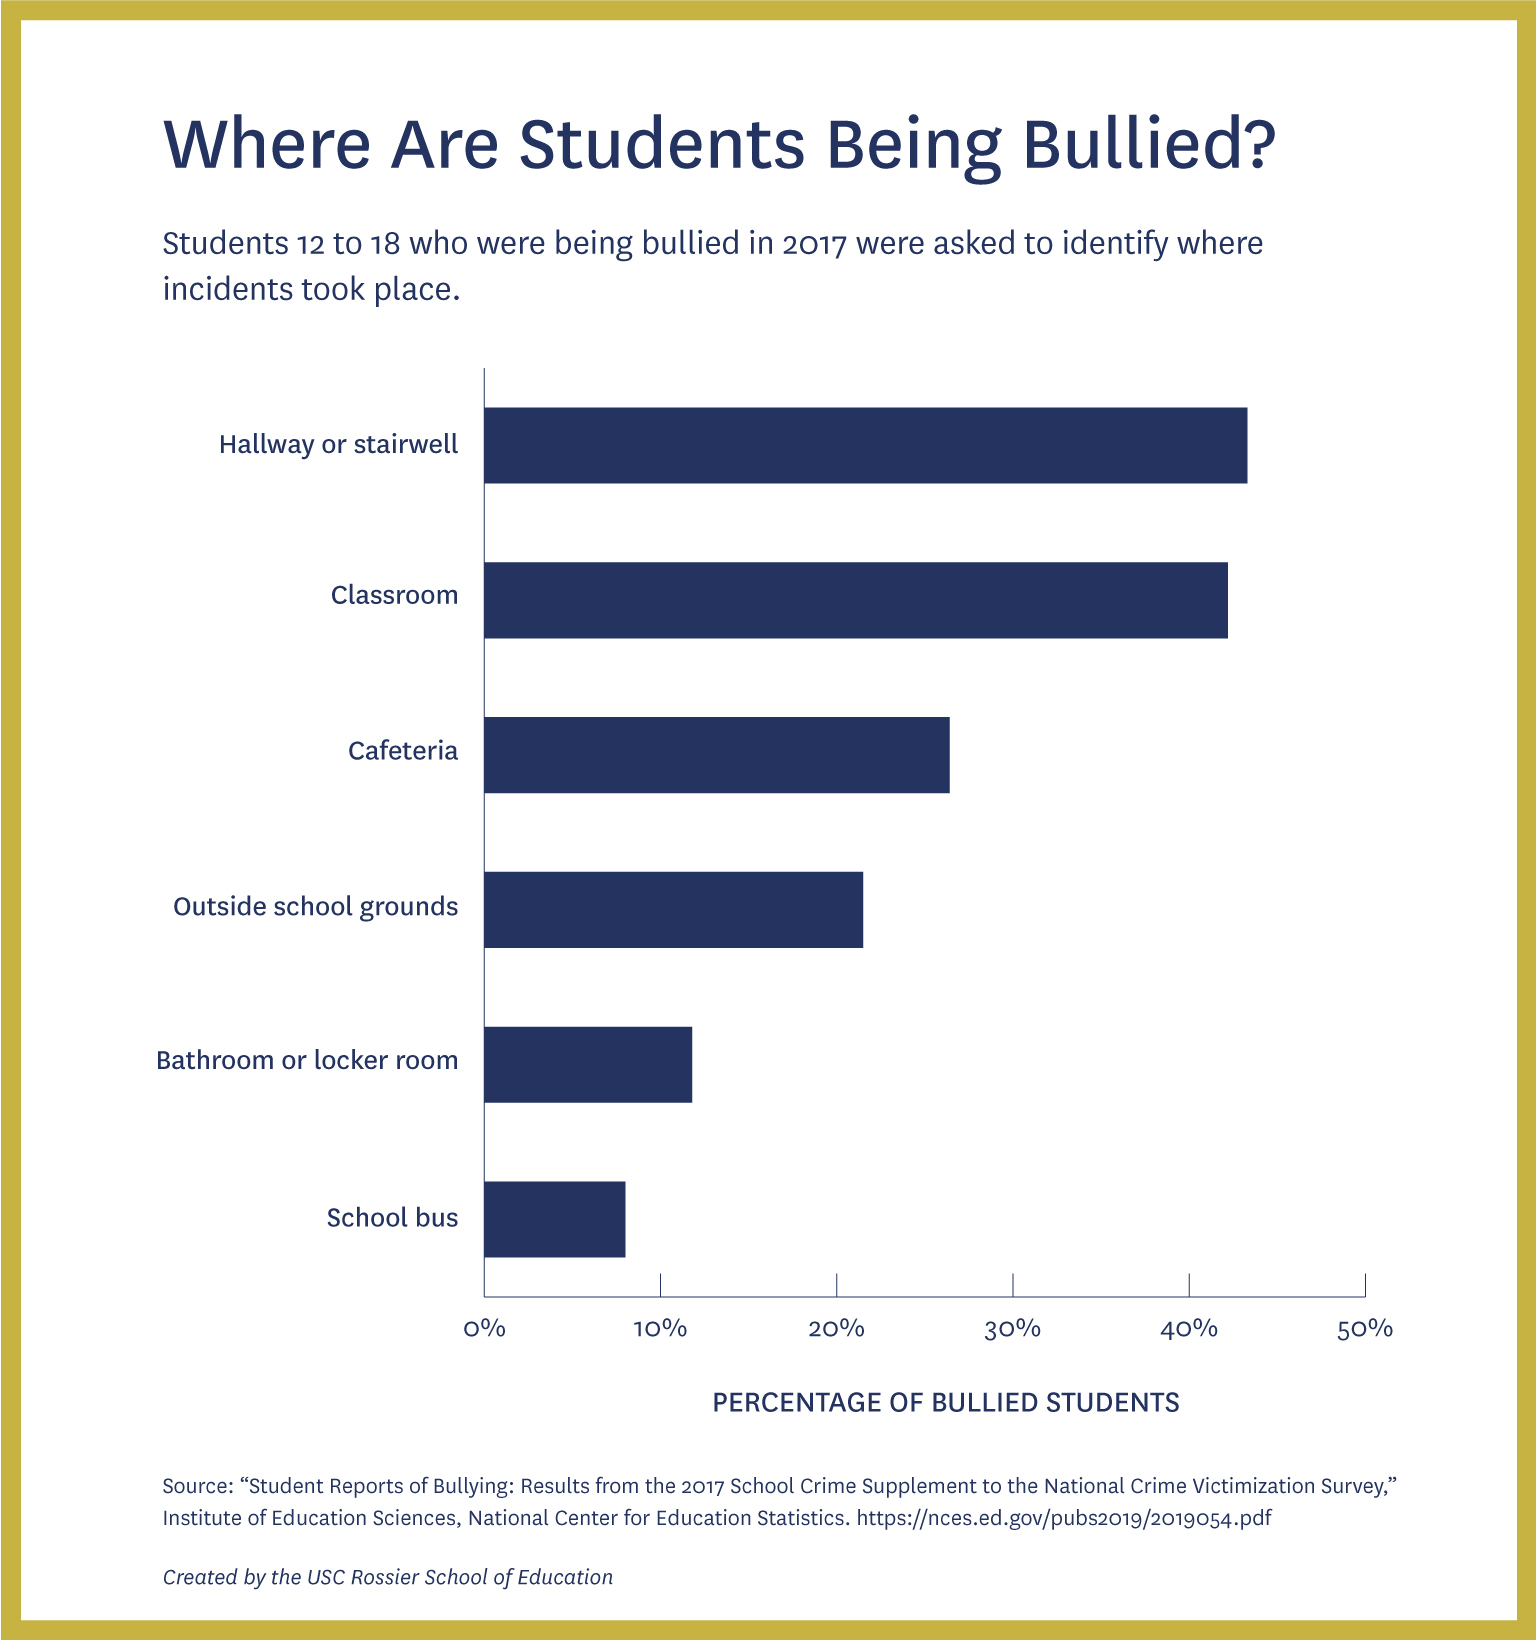
Go to the bottom of the page to review tabular data about the locations of bullying.
What Can Teachers Do to Prevent Bullying?
To foster safe and respectful classrooms, the Department of Education advises teachers to focus on respect, inclusion and open communication. The department developed a training toolkit that identifies the primary features of a supportive classroom (PDF, 391 KB):
Engagement: Educators model positive thinking and respectful behavior, while proactively encouraging conversations about tolerance, inclusivity and diversity. They also listen to students’ experiences.
Environment: Educators also model appropriate expectations for relationships and work directly with not only students who are being bullied but also students who are bullying others to establish a culture of respect for differences.
Safety: Educators intervene when they see problems and make bully-free culture the norm by teaching positive relationship skills and clear ground rules for behavior.
Teachers can watch for warning signs of bullying, such as unexplained injuries, frequent illness, decline in school attendance, decline in grades, isolation and avoidance of social situations.
How Should Teachers Intervene When Bullying Occurs?
When bullying occurs, teachers should intervene immediately. A Department of Education toolkit provides a four-step approach (PDF, 1.1 MB):
STEP 1
Stop the Behavior
Keep calm, make sure everyone is safe, and reassure all the students involved. Separate them and ask what they need from you, including any medical attention.
STEP 2
Find Out What Happened
Listen to as many sources as you can, document what you hear and see, and collect other evidence that may help you determine whether bullying occurred. Don’t make assumptions.
STEP 3
Support the Students Involved
Both the student who is bullied and the student who bullied need support. Allow the student being bullied to share their story and reassure them that bullying is not their fault. The student who bullied needs to understand why their behavior may be problematic, what the consequences are according to school policy and how they can be involved in making amends.
STEP 4
Report and Follow Up
A thorough report of what happened, where the incident took place and other evidence can enable schools to track patterns of behavior and properly address the issue. Following up ensures that students who are bullied know they are supported and safe.
How Can Students Help Prevent Bullying?
Every student can help make schools safer places to learn for their peers. The Department of Education toolkit on bullying prevention provides tips for students who witness bullying:
How to Help a Targeted Student
Reinforce that bullying is wrong and ask how you can help.
Help the targeted student remove themselves from the situation.
Encourage the targeted student to tell an adult.
Reach out for help from an adult.
How to Create a Safer School Climate
Don’t engage in bullying.
Be kind and listen to students that are targeted.
Go out of your way to socially interact with targeted students.
Find ways to promote anti-bullying efforts.
The following section contains tabular data from the graphics in this post.
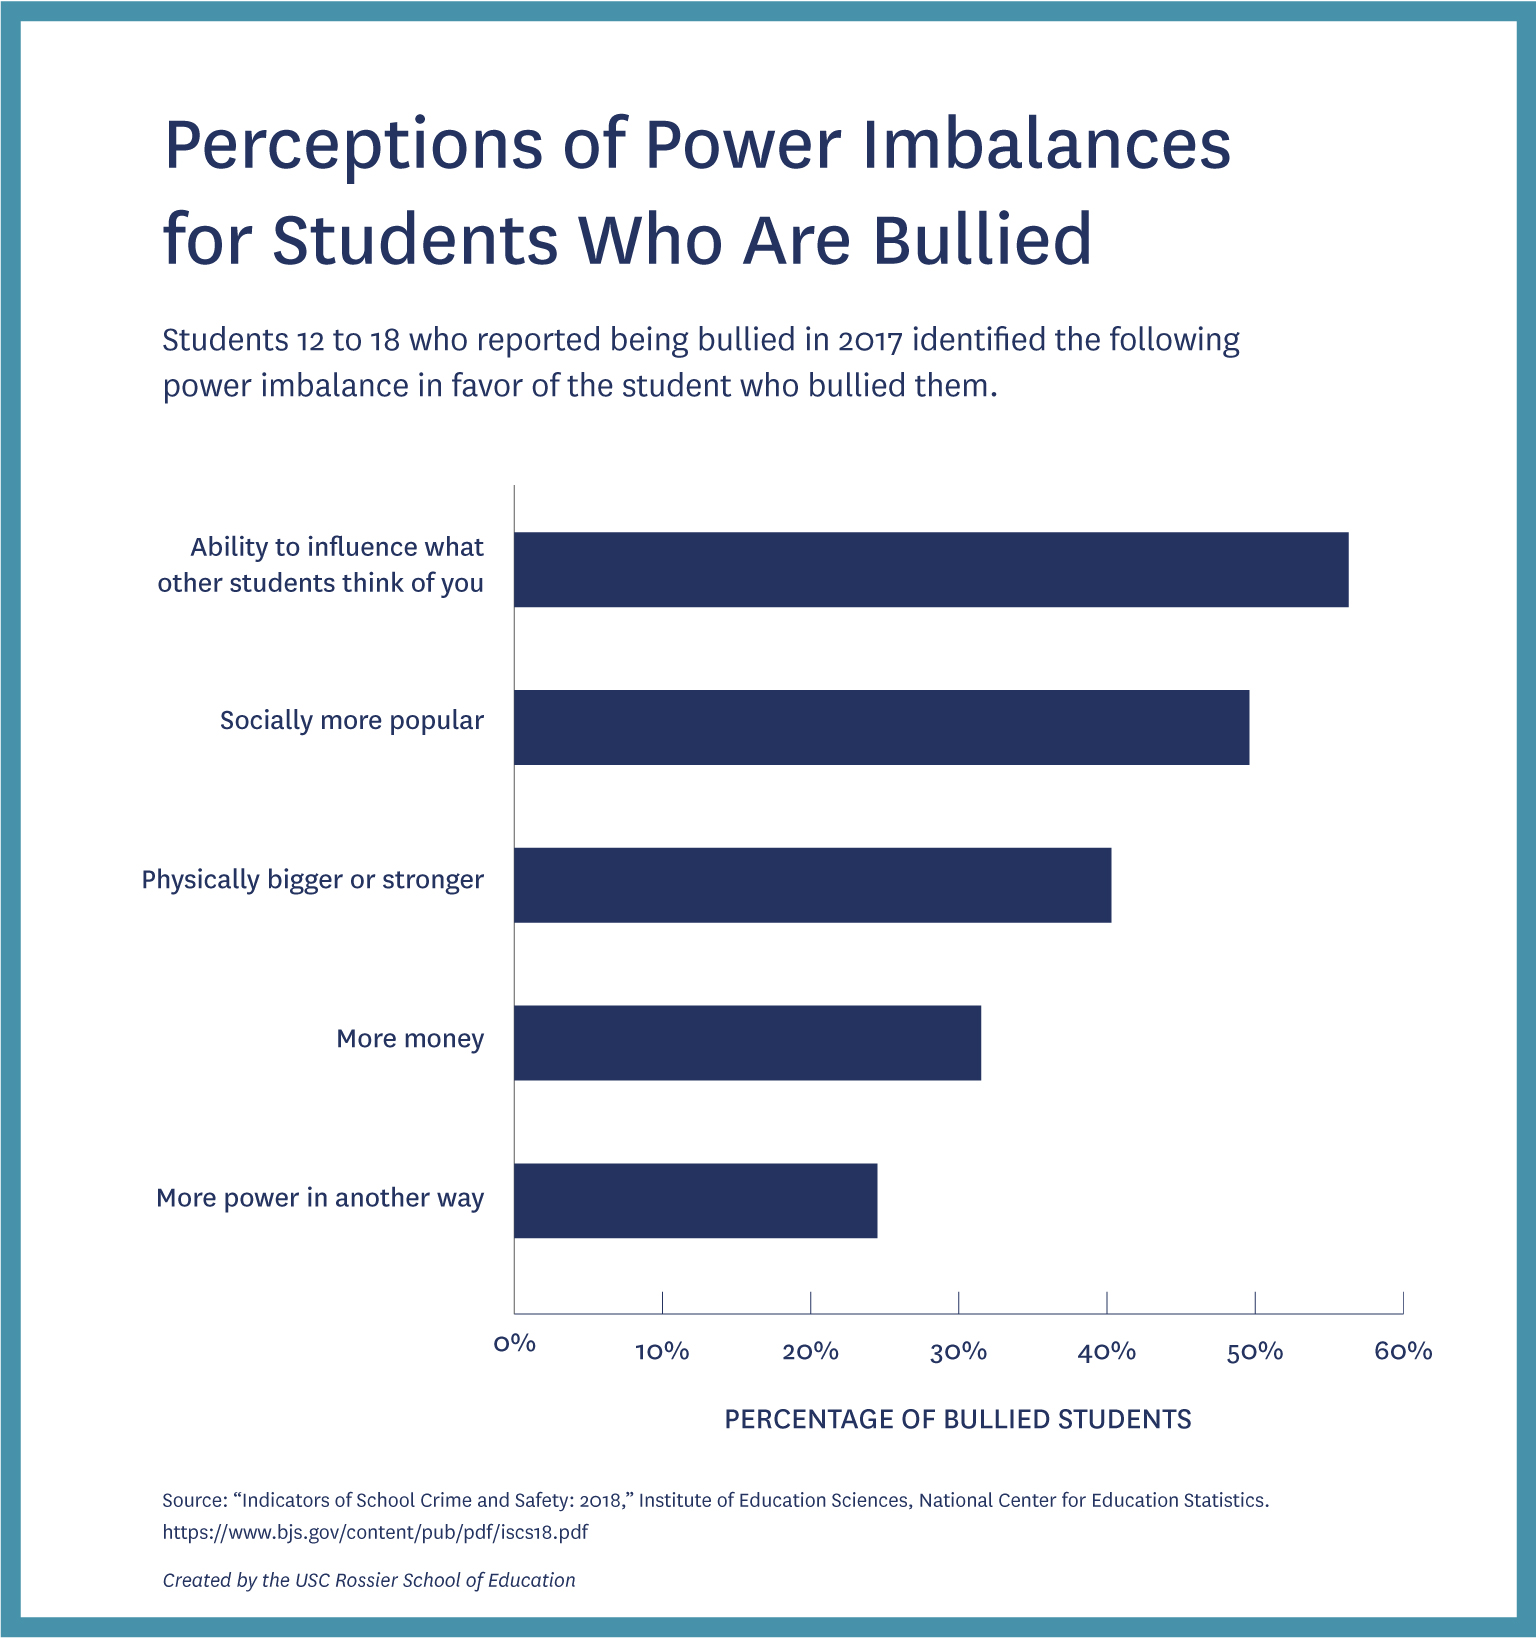
Perceptions of Power Imbalances for Bullied Students
Students 12 to 18 who reported being bullied in 2017 identified the following power imbalance in favor of the student who bullied them.
| Perceived Power Imbalance | Percentage of Bullied Students |
|---|---|
Ability to influence what other students think of you | 53.3 |
Socially more popular | 49.6 |
Physically bigger or stronger | 40.3 |
More money | 31.5 |
More power in another way | 24.5 |
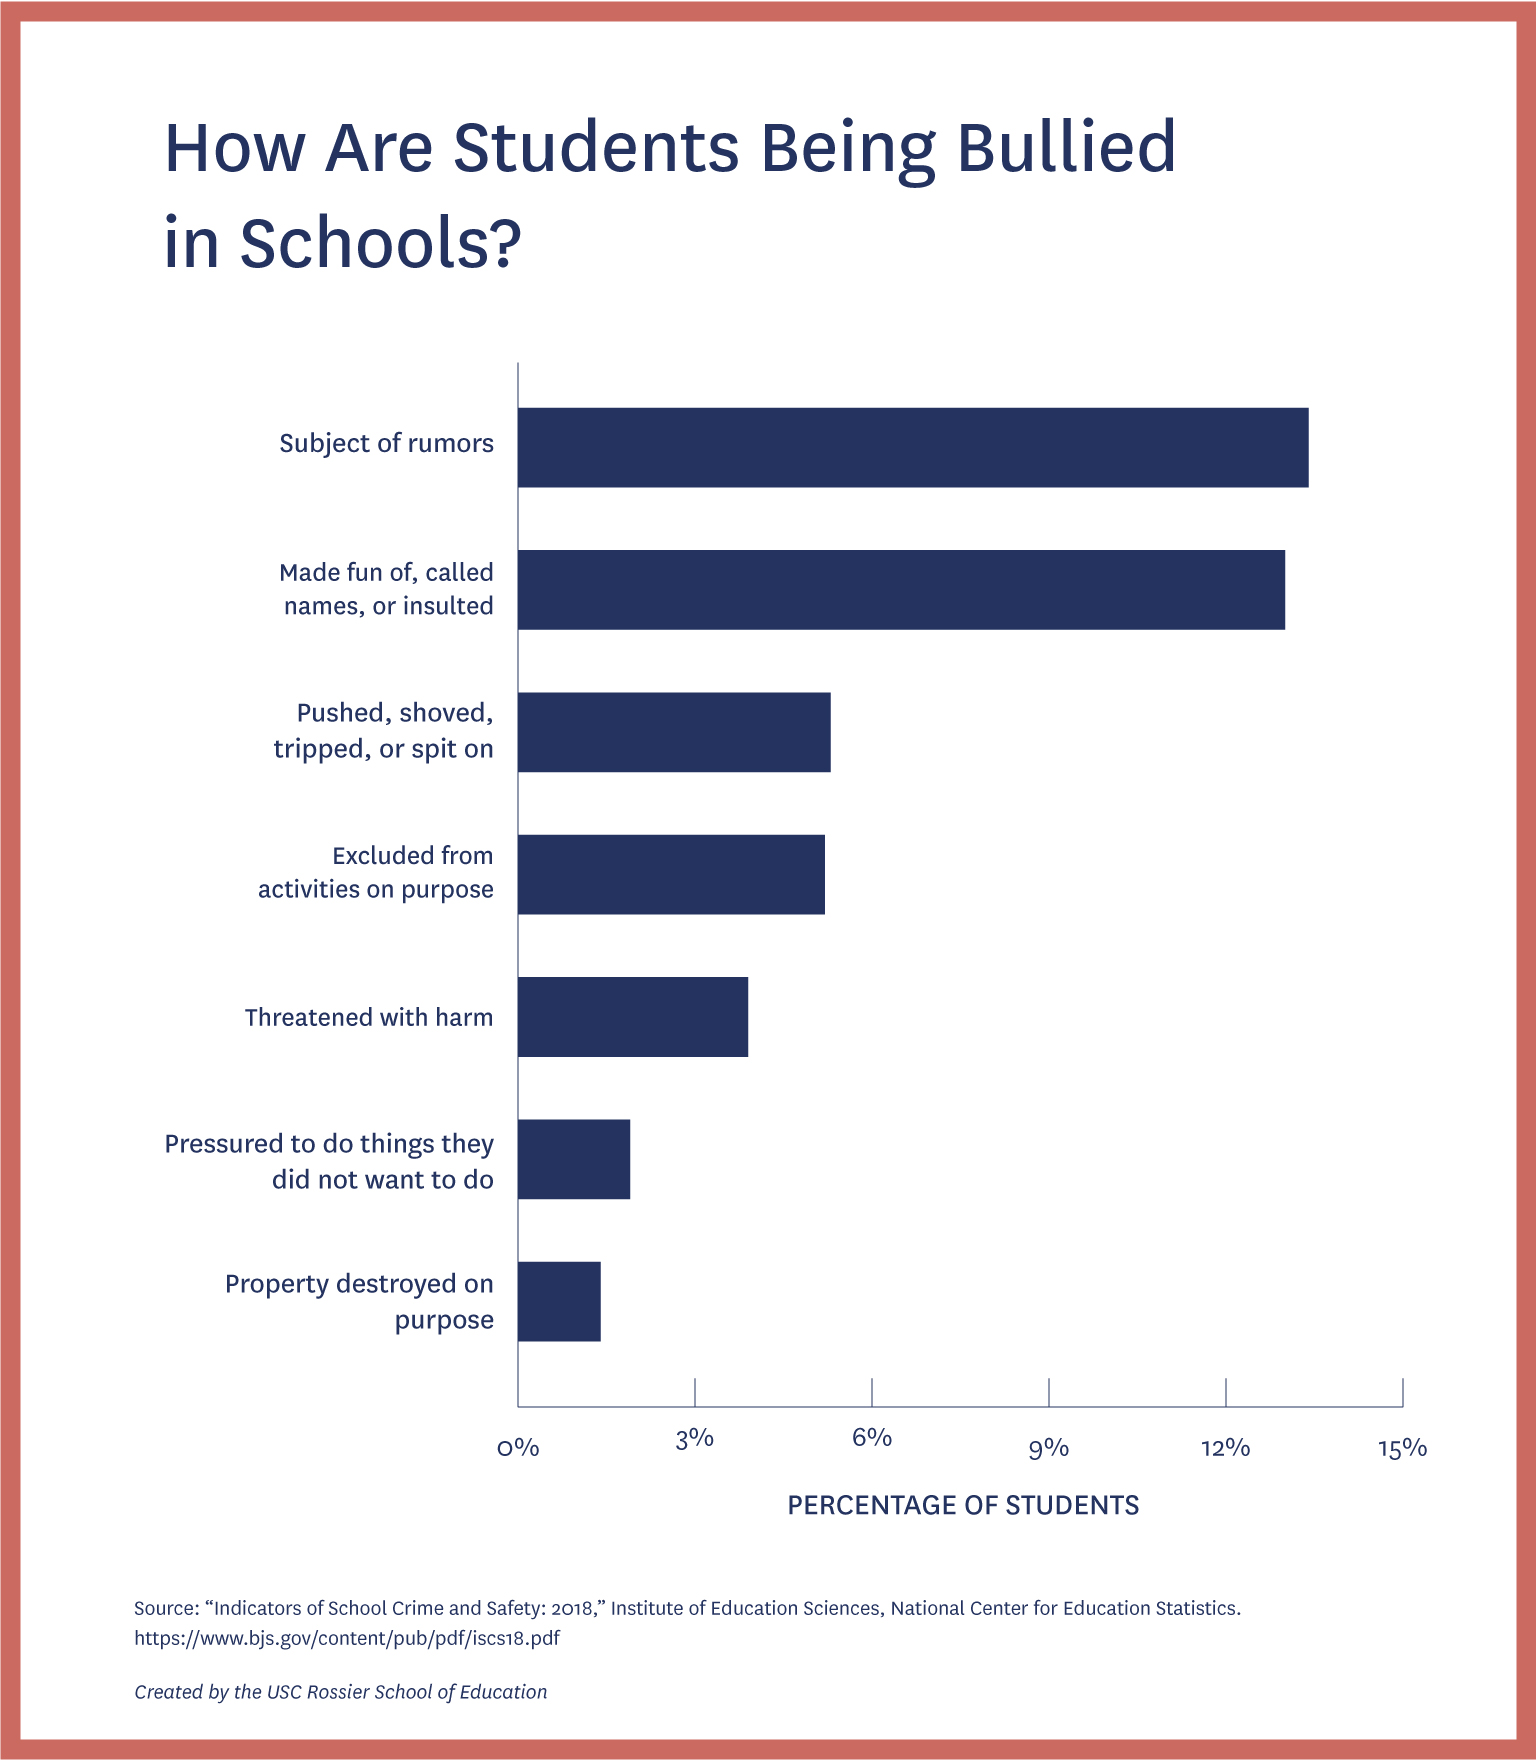
How Are Students Being Bullied in Schools?
| Types of Bullying of Students Ages 12 to 18 in 2017 | Percentage of Students |
|---|---|
Subject of rumors | 13.4% |
Made fun of, called names, insulted | 13% |
Pushed, shoved, tripped, spit on | 5.3% |
Excluded from activities on purpose | 5.2% |
Threatened with harm | 3.9% |
Pressured to do things they did not want to do | 1.9% |
Property destroyed on purpose | 1.4% |
Effects of Bullying on Students
Students 12 to 18 who reported being bullied in 2017 said that bullying had negative effects on following aspects of their lives.
| Bullying Negatively Affected | Percentage of Bullied Students |
|---|---|
How they felt about themselves | 26.8% |
School work and relationships | 19.4% |
Relationships with family and friends | 18.6% |
Physical health | 13.7% |
Where Are Students Being Bullied?
Students 12 to 18 who were bullied in 2017 were asked to identify where incidents took place.
| Location | Percentage of Bullied Students |
|---|---|
Hallway or stairwell | 43.3% |
Classroom | 42.2% |
Cafeteria | 26.4% |
Outside school grounds | 21.5% |
Bathroom or locker room | 11.8% |
School bus | 8.0% |
Citation for this content: The USC Rossier MAT online program.


